
Why use Splunk?
Using Splunk to monitor your computer or vps is free, easy and let you learn about one of the best SIEM tool available on the market (as for now 2022). In this post I will share some of my personal Splunk configurations and alerts so you can start monitoring what is going on in your windows machine and maybe see things you didn’t before. So let’s start shall we!
We know we want to use Splunk, now what? First of all you gotta go and download Splunk free here. The free version come with a limitation of 500mb ingested per day (when the ‘enterprise trial’ end). It should be enough for our needs, but if you want more, you can enroll into the dev program and get a development license permitting 10go per day. If you go with the dev license, just know that you need to renew it every 6 month, if you don’t you will be reverted to the free license.
The installation of Splunk is pretty trivial, so i will skip this part. Install the tool, configure the administration account and there it is you should have a Splunk instance running on http://127.0.0.1:8000.
What log to ingest
Now that we got a Splunk instance running, we need to collect the windows event logs from the machine! Windows events will be the main source of data used to do the monitoring. You can ingest windows events without a Splunk Universal Forwarder when you ingest the data from the same computer. So this is what we are going to do.
How to add data to your Splunk instance
Here are the steps to configure event log monitoring on a local machine:
Go to Settings > Data inputs
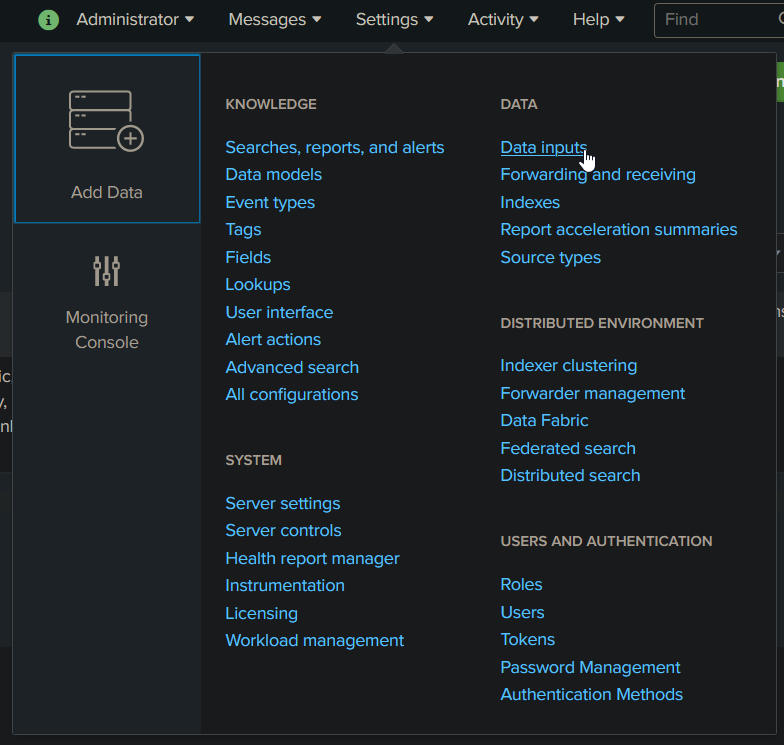
Select the Local Event Log Collection option
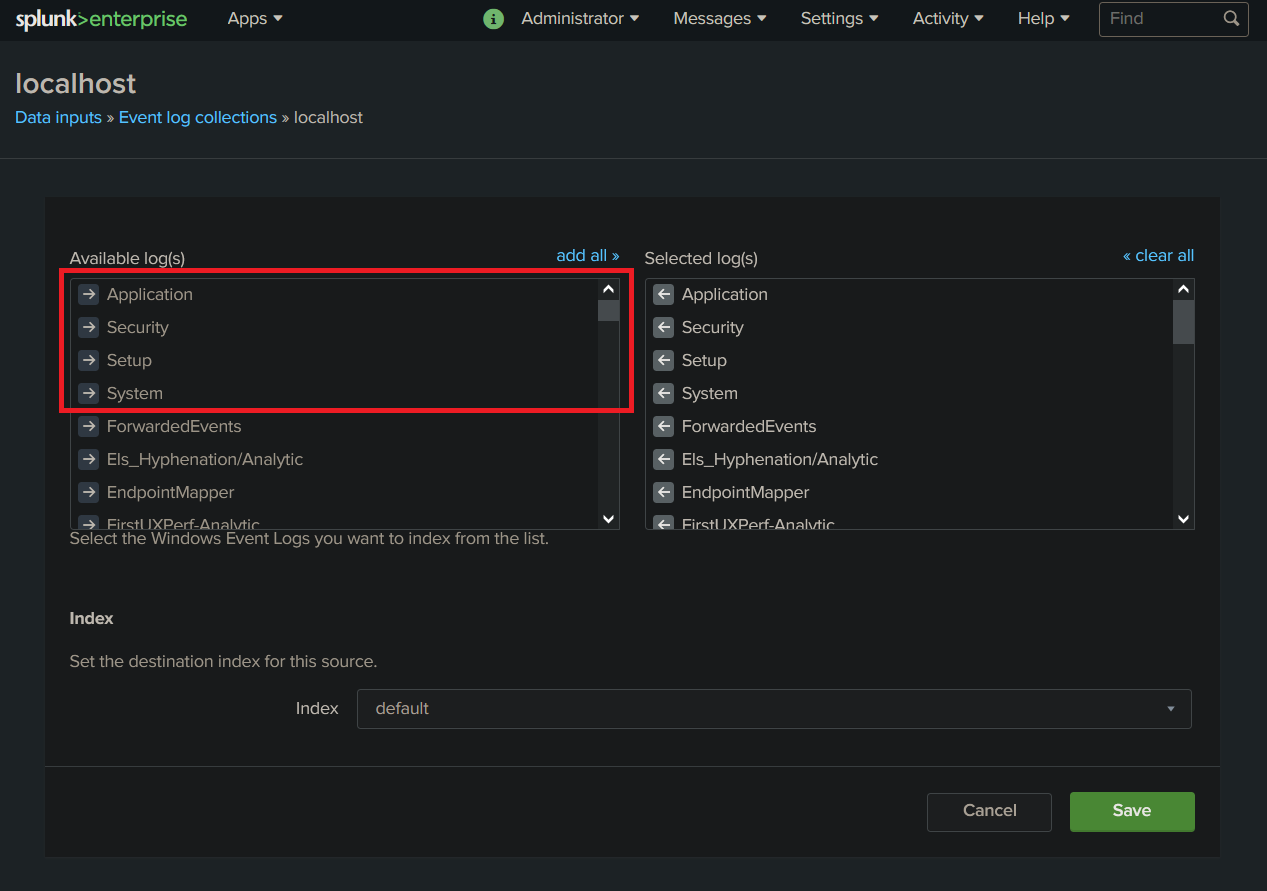
From there you need to choose which log will be ingested. For research purpose I choose to ingest everything from Application, Security, Setup, System.
Here is what it should look like :
Now that we ingest data, we can go ahead and make a quick search. You can go to the search page and use this string to verify if your instance is running correctly :
sourcetype="wineventlog:security"
You should see something like this :

Here is the tutorial I used for my setup if you need more info : Collect event logs from a local windows machine
What can we monitor with this setup?
You can monitor about anything on your machine with a little work. We will leverage custom queries that allow us to detect unwanted activities on the monitored system. I will show you some basic queries and then use them to generate Alerts!
Failed login
EventCode=4776 AND Keywords="Audit Failure"
In this query we will look for failed login attempt, to do so we will search for the right event id (4776) and look for the text “Audit Failure” that is included inside the event log when a failed attempt occur.
Here is some more info about this event ID :
Event code 4776: The domain controller attempted to validate the credentials for an account
Despite what this event says, the computer is not necessarily a domain controller; member servers and workstations also log this event for logon attempts with local SAM accounts. [Source]
Login from unknown computer
LogName=*Security* EventCode=4624 NOT (host="###HOST_1_NAME###" OR host="###HOST_2_NAME###") NOT (Account_Name="*$" OR Account_Name="ANONYMOUS LOGON") NOT (Account_Name="Service_Account") | eval Account_Domain=(mvindex(Account_Domain,1)) | eval Account_Name=if(Account_Name="-",(mvindex(Account_Name,1)), Account_Name) | eval Account_Name=if(Account_Name="*$",(mvindex(Account_Name,1)), Account_Name) | eval Time=strftime(_time,"%Y/%m/%d %T") | stats count values(Account_Domain) AS Domain, values(host) AS Host, dc(host) AS Host_Count, values(Logon_Type) AS Logon_Type, values(Workstation_Name) AS WS_Name, values(Source_Network_Address) AS Source_IP, values(Process_Name) AS Process_Name by Account_Name | where Host_Count > 2
Here we will look for event id 4624 that occur when an account login. When this event is triggered it will contain the host that is connecting. In the context of a machine remotely accessed, it let you find when unknown hosts are accessing your machine. Just change host “###HOST_1_NAME###” and “###HOST_2_NAME###” for the names of trusted hosts.
Here is some more about event 4624
4624: An account was successfully logged on
This is a highly valuable event since it documents each and every successful attempt to logon to the local computer regardless of logon type, location of the user or type of account. You can tie this event to logoff events 4634 and 4647 using Logon ID. [Source]
Unauthorized Administrator or Guest account login/try
LogName=*Security* EventCode=4625 (Account_Name=administrator OR Account_Name=guest OR Account_Name=administrateur) | stats count values(Workstation_Name) AS Workstation_Name, Values(Source_Network_Address) AS Source_IP_Address, values(host) AS Host by Account_Name | where count > 1
Event ID used is account failed to login and then we check for the use of the guest or the administrator account.
4625: An account failed to log on
This is a useful event because it documents each and every failed attempt to logon to the local computer regardless of logon type, location of the user or type of account. [Source]
Unauthorized access to shares
source="WinEventLog:Security" EventCode=5140 (Share_Name="*\\C$" OR Share_Name="*D$" OR Share_Name="*E$" OR Share_Name="*F$" OR Share_Name="*U$") NOT Source_Address="::1" | eval Destination_Sys1=trim(host,"1") | eval Destination_Sys2=trim(host,"2") | eval Dest_Sys1=lower(Destination_Sys1) | eval Dest_Sys2=lower(Destination_Sys2) | rename host AS Destination | rename Account_Domain AS Domain | where Account_Name!=Dest_Sys1 | where Account_Name!=Dest_Sys2 | stats count values(Domain) AS Domain, values(Source_Address) AS Source_IP, values(Destination) AS Destination, dc(Destination) AS Dest_Count, values(Share_Name) AS Share_Name, values(Share_Path) AS Share_Path by Account_Name
In this query we look for any connection to network shares.
5140: A network share object was accessed
Windows logs this event the first time you access a given network share during a given logon session. Be aware that Windows Server 2008 logs off network logon sessions even sooner than past versions of Windows. When a user closes all open files on a server it seems to immediatelly log him off. [Source]
Powershell bypass
EventCode=4688 (powershell* AND (–ExecutionPolicy OR –Exp)) OR (powershell* AND bypass) OR (powershell* AND (-noprofile OR -nop)) | eval Message=split(Message,".") | eval Short_Message=mvindex(Message,0) | table _time, host, Account_Name, Process_Name, Process_ID, Process_Command_Line, New_Process_Name, New_Process_ID, Creator_Process_ID, Short_Message
Here we look for Powershell bypass leveraging new process created event.
4688: A new process has been created
Event 4688 documents each program that is executed, who the program ran as and the process that started this process.
When you start a program you are creating a “process” that stays open until the program exits. This process is identified by the Process ID:. You can correlate this event to other events by Process ID to determine what the program did while it ran and when it exited (event 4689). [Source]
Suspect process detected
LogName=*Security* EventCode=4688 NOT (Account_Name=*$) (arp.exe OR at.exe OR bcdedit.exe OR bcp.exe OR chcp.exe OR cmd.exe OR cscript.exe OR csvde OR dsquery.exe OR ipconfig.exe OR mimikatz.exe OR nbtstat.exe OR nc.exe OR netcat.exe OR netstat.exe OR nmap OR nslookup.exe OR netsh OR OSQL.exe OR ping.exe OR powershell.exe OR powercat.ps1 OR psexec.exe OR psexecsvc.exe OR psLoggedOn.exe OR procdump.exe OR qprocess.exe OR query.exe OR rar.exe OR reg.exe OR route.exe OR runas.exe OR rundll32 OR schtasks.exe OR sethc.exe OR sqlcmd.exe OR sc.exe OR ssh.exe OR sysprep.exe OR systeminfo.exe OR system32\\net.exe OR reg.exe OR tasklist.exe OR tracert.exe OR vssadmin.exe OR whoami.exe OR winrar.exe OR wscript.exe OR "winrm.*" OR "winrs.*" OR wmic.exe OR wsmprovhost.exe OR wusa.exe) NOT ( sc.exe AND conhost.exe AND S-1-5-19 AND %%1936 ) | eval Message=split(Message,".") | eval Short_Message=mvindex(Message,0) | table _time, host, Account_Name, Process_Name, Process_ID, Process_Command_Line, New_Process_Name, New_Process_ID, Creator_Process_ID, Short_Message
Again we use the event id 4688 to look for known malicious process created. You can trigger this one easily if you fool around in command line and with more technical tools. You can reduce log by excluding your own account name, but i don’t recommend it.
Powershell escape
LogName=*Security* (EventCode=4688) NOT (Account_Name="###YOUR_ACCOUNT_NAME###") (iexec.exe OR InstallUtil.exe OR Regsrv32.exe OR Regasm.exe OR Regsvcs.exe OR MSBuild.exe) | eval Message=split(Message,".") | eval Short_Message=mvindex(Message,0) | table _time, host, Account_Name, Process_Name, Process_ID, Process_Command_Line, New_Process_Name, New_Process_ID, Creator_Process_ID, Short_Message
Finally we can detect a few Powershell escape techniques using a few known executable. You need to replace “###YOUR_ACCOUNT_NAME###” by the account name you are using.
How to set an alert from a query
Now that we know a few queries, we are ready to generate alert from them. Those alert will be raised inside splunk web console and can also trigger email notification.
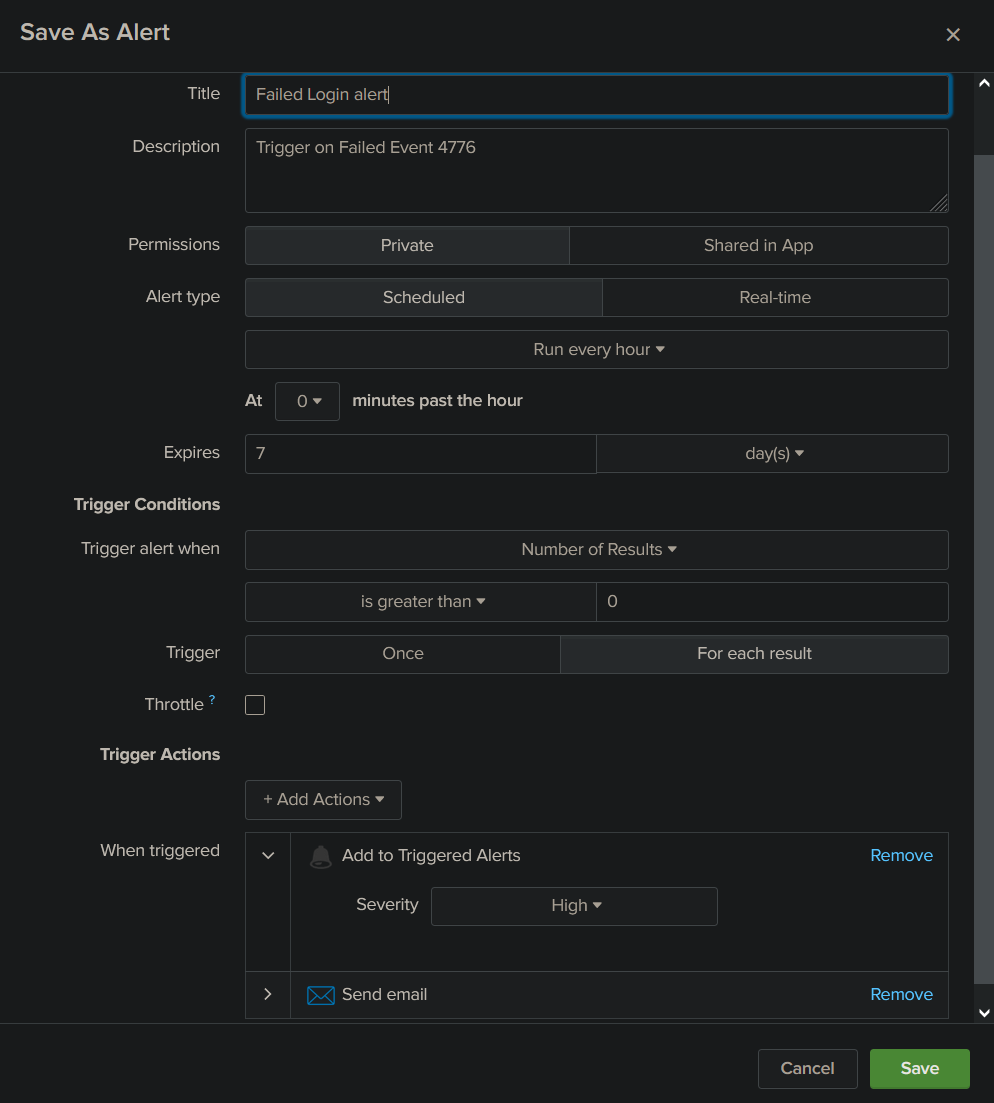
Start by searching the query you want to get alerts from. Then select Save As > Alert.

Here is an example of an alert that will trigger every hour when the query get a new result. It will then set a determined severity to the event and send an email containing customizable information to your address. I will share my custom recipe for the alert email, but I strongly suggest you to experiment with different options until you find what you need.
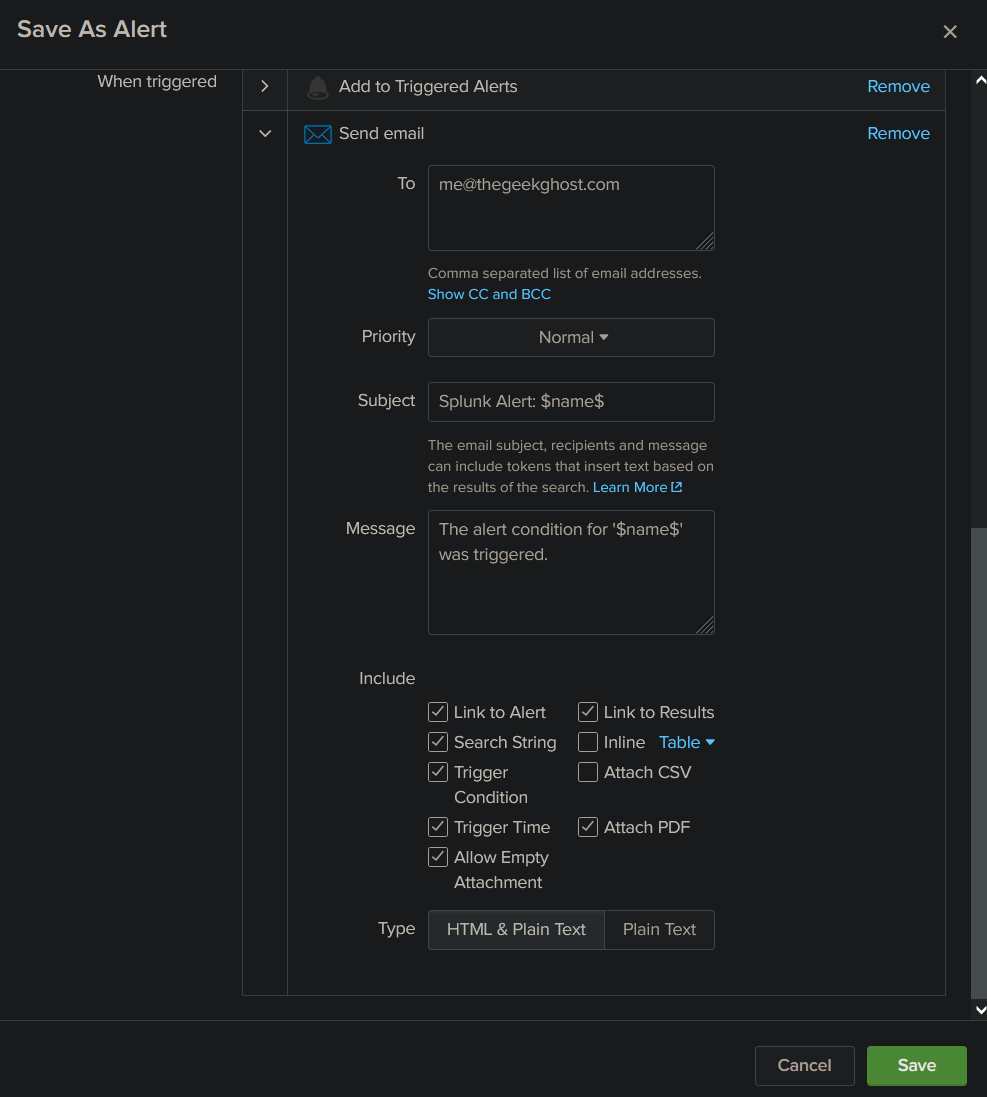
Here it is, now you are more than able to monitor your windows system and get notifications when something unusual is happening. If you come up with some new queries, please share them!
Update 1 (2022-07-20) :
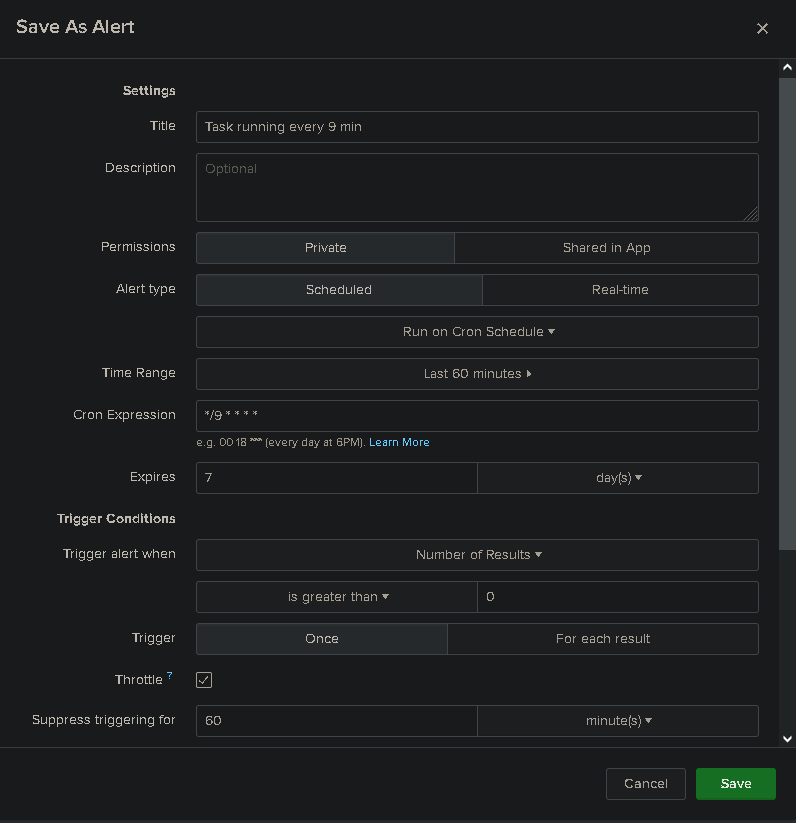
Alert can be ajusted to run every X minutes (using cron jobs). Here is an example of this setting in action.
Here is a quick list of new events worth monitoring on your system. You can find more info about those here.
NSA Event ID of interest :
EventCode=4740
EventCode=4781
EventCode=4733
EventCode=1518
EventCode=5376
EventCode=4720
EventCode=4722
EventCode=4782
EventCode=4793
EventCode=4726
EventCode=1511
EventCode=4725
EventCode=4767
EventCode=4728
EventCode=4732
EventCode=4756
Sources
>Collect event logs from a local Windows machine
>WINDOWS SPLUNK LOGGING CHEAT SHEET – Win 7 – Win2012 [PDF alternative link]
